Yesterday, I was reading Lauren Klein’s recently-posted talk on her work about Thomas Jefferson and his enslaved cook, James Hemings, when I found a tool I wish I’d known about sooner. Lauren made her images with Protovis, a Javascript visualization toolkit produced by the Stanford Visualization Group.
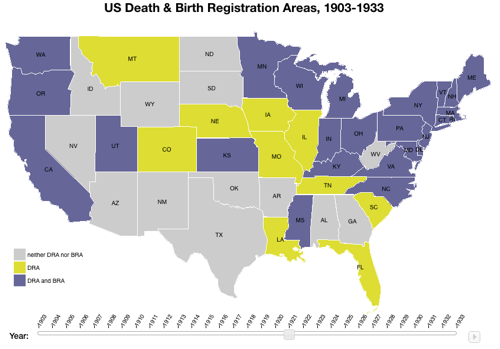
Protovis can do all kinds of things, but I was particularly taken with the choropleth map example, which bears a striking resemblance to a problem I’ve been wanting to work up a visualization for. It took a while to figure out how to adapt their example to the data I’ve got, but here’s what I ended up with.
This image is for 1921. Gray states didn’t meet the federal standards for birth registration or death registration; yellow states registered deaths well; purple states registered births and deaths well. You can click on the image for an interactive version that’ll let you set what year to examine.
The ability to play with this has helped me think about the periodization of my story in new ways that the source data (rendered in a table on page 59 of this PDF) just wasn’t. (Note the lack of good coverage in heavily rural states, especially the southeast and southwest. These states developed better birth registration by the late 1920s as a result of federal funding from the Sheppard-Towner Act.)
Want to do this yourself?
For those of you who have a similar research problem that might be able to use some visualization, I’ve posted the code on GitHub. You don’t need a web server to run it; all you’ll need is to modify the data file with your own state-level data. If you change the names of any variables in that file, you’ll need to search-and-replace them in the main page’s scripts as well.
